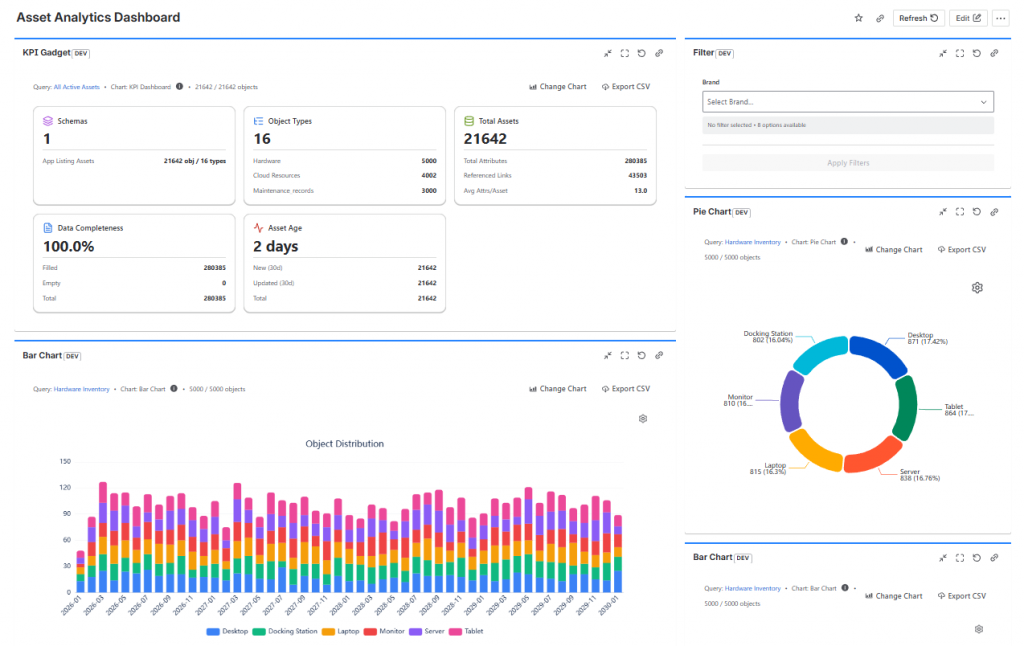
Transform Jira Assets into actionable insights. Build AQL queries visually, generate reusable dashboards, and monitor CMDB data with interactive charts and KPIs.
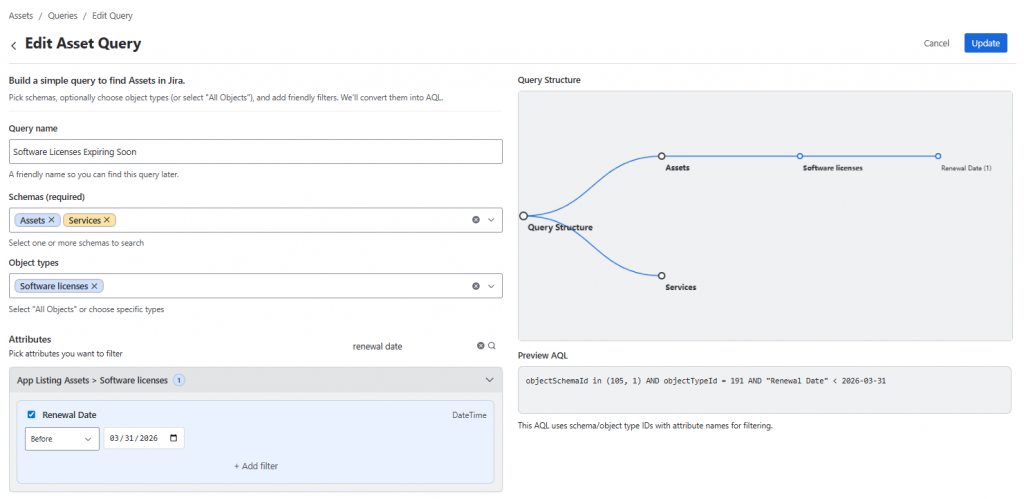
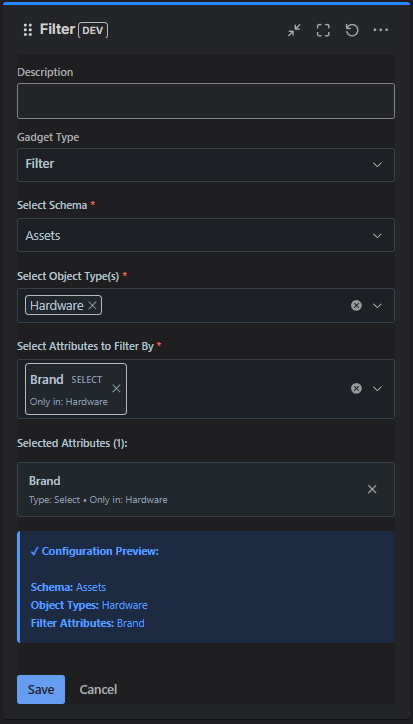
Go to the Global Query Management page, click Create Query (or the + button), select schemas, types, and attributes, define filter conditions, name the query, and save it.
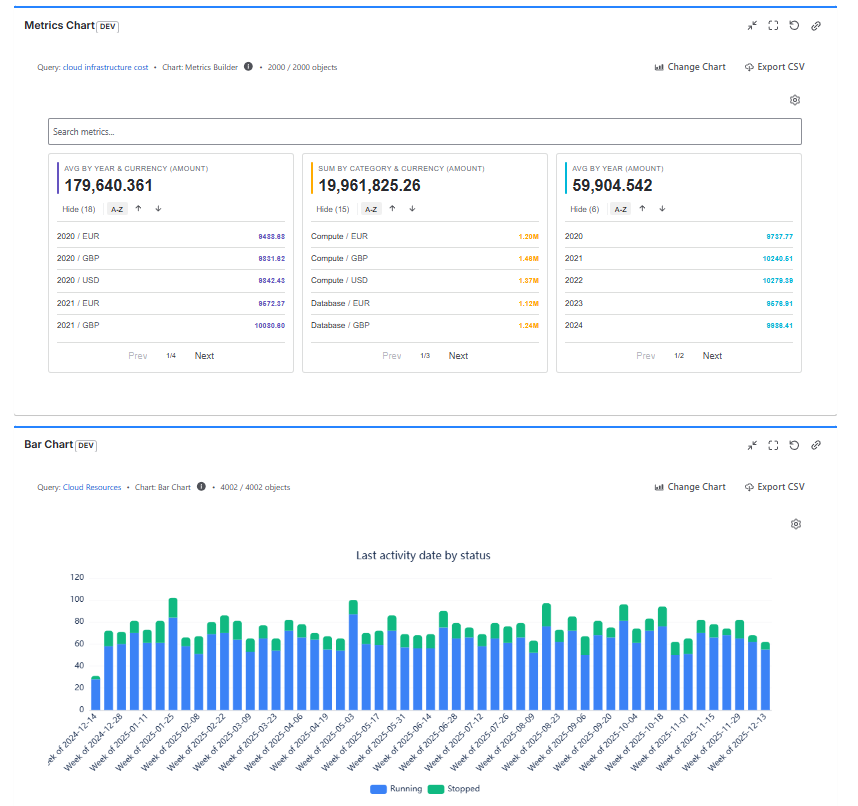
Yes. A single saved query can power multiple visualization types. For example, the same dataset can be displayed as a table, a bar chart, and a KPI without duplicating logic.
Yes. Charts reflect the latest data from Jira Assets. Refreshing the dashboard or using the refresh control ensures the most recent query results are displayed.
Yes. All charts include an Export to CSV feature that preserves current filters in the exported dataset.
Manage Consent
To provide the best experiences, we use technologies like cookies to store and/or access device information. Consenting to these technologies will allow us to process data such as browsing behavior or unique IDs on this site. Not consenting or withdrawing consent, may adversely affect certain features and functions.
Functional
Always active
The technical storage or access is strictly necessary for the legitimate purpose of enabling the use of a specific service explicitly requested by the subscriber or user, or for the sole purpose of carrying out the transmission of a communication over an electronic communications network.
Preferences
The technical storage or access is necessary for the legitimate purpose of storing preferences that are not requested by the subscriber or user.
Statistics
The technical storage or access that is used exclusively for statistical purposes.The technical storage or access that is used exclusively for anonymous statistical purposes. Without a subpoena, voluntary compliance on the part of your Internet Service Provider, or additional records from a third party, information stored or retrieved for this purpose alone cannot usually be used to identify you.
Marketing
The technical storage or access is required to create user profiles to send advertising, or to track the user on a website or across several websites for similar marketing purposes.